|
Volatility Chart Viewer |
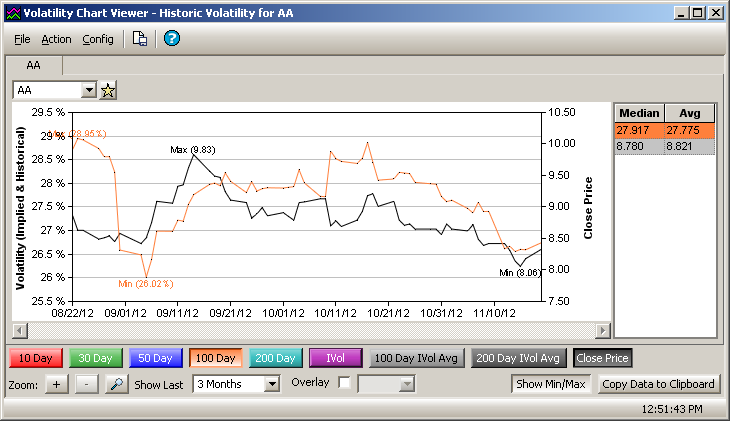
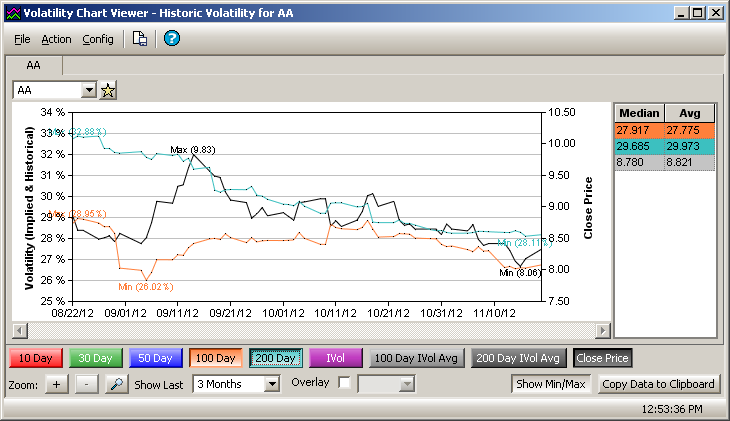
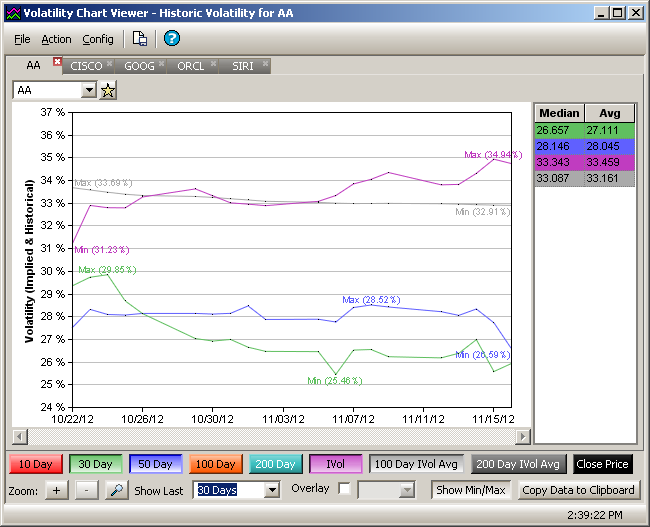
With the Volatility Chart Viewer the volatility of a security can be displayed in a graph with a number of display options. A maximum of three years of charting data is available. The volatility is displayed as a percentage (both implied and historical) over a defined time period. The selected time along with closing prices and other measurable data can be incorporated in the graph. Additionally, the graph data can be saved as a text file or image file.
Launch Volatility Chart Viewer
Select Charting Dates on the X Axis
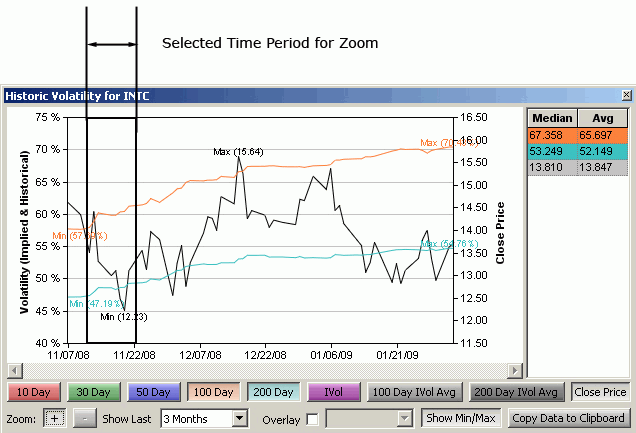
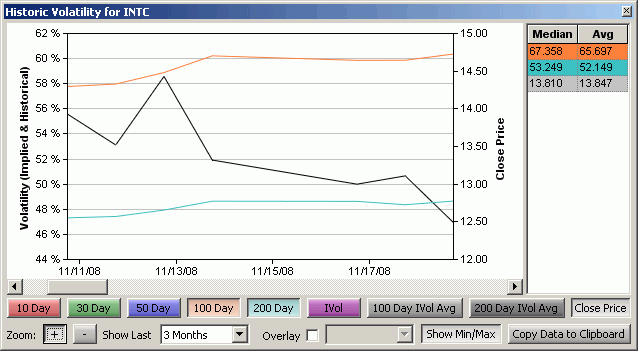
Zoom into the Volatility Chart Viewer
Overlay Other Symbols in the Volatility Chart Viewer
Send Symbols to Other WTP Apps with the "Send To" feature
© 2015 Wolverine Execution Services, LLC