

 Equity Time and Sales
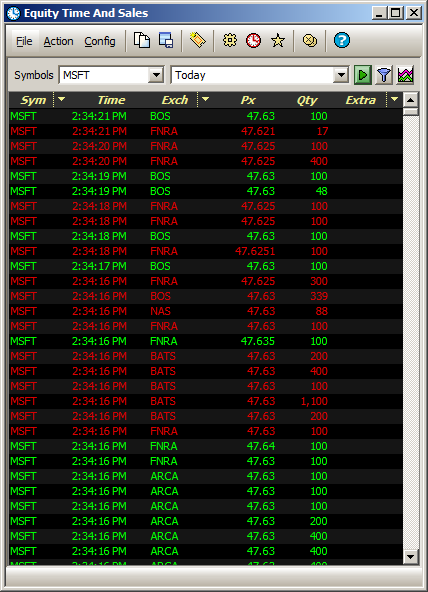
With Equity Time and Sales you can view tick-by-tick details for securities over a defined time period. One or more symbols, along with a time span for reporting, are entered. Equity Time and Sales will retrieve all sales for the symbols that fall within the defined time period. Additionally, any number of filters can be applied to the reporting of sales data. If filters are employed, Equity Time and Sales table will report sales data when a filtered condition is met. Optionally, a notification can be sent when a symbol matches the filtered parameters.
From the WTP toolbar select Analyze -->Equity Time and Sales.
Alternate Method:
From the WTP menu select Equity Time and Sales.
Basic Operation (without filters)
One or more symbols can have their sales data reported in Equity Time and Sales.
Entering symbols:
Type the
symbol name in the Symbols field. Separate symbol names with the
semi-colon or comma.
Alternate
Method:
Select one or more symbols from the drop-down list. Check each
box next to the symbol name that is to be reported.
Press the
start button  to begin the retrieval of sales
data. Press the stop button
to begin the retrieval of sales
data. Press the stop button  to stop receiving sales data.
Equity Time and Sales can be configured to report real-time ticks in one of three defined time periods:
Today
(all ticks from midnight of the current day)
Yesterday (all ticks up until
midnight of the previous day)
Custom
(tick data retrieved between the two defined time/date settings).
When selected, the Time Span
window launches:
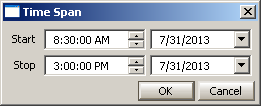
Enter the start/stop times (or use the up/down spinner arrows),
and select a date from the drop-down list.
With the filter option enabled, Equity Time and Sales displays data that matches defined conditions. For example, if it is preferable to view only data from a specific exchange, a filter can be defined accordingly. When a filter is in force, the filter will be displayed in the Equity Time and Sales window.
Setting Filters
Press
the Set Filter button
 .
The Filters screen opens:
.
The Filters screen opens:
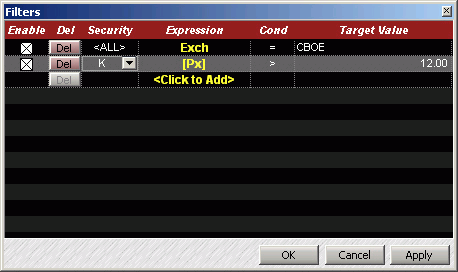
Similar to Set Row Color Conditions the securities are defined, with its expression and condition. In the example above, all securities exclusively from the CBOE are to be displayed. Also the security K is to be displayed when its target value is greater than $12.00.
Check the Enable box on each row to have the filter act on that row.
Press OK or Apply to have the filter(s) enabled. To exit without saving, press Cancel.
Delete a Filter
Press the DEL button on each row to delete that row's filter.
The columns available for display in Equity Time and Sales are defined on the configuration screens. Also, optional symbol tracking and notifications can be selected.
Access the Configuration Screens
Right-click on the Equity Time and Sales window and select Configuration.
Alternate Method:
From the Config menu select Configuration.
Time and Sales Grid
See Columns and Formatting for instructions on defining columns, their fonts, sizes, and row color conditions.
Miscellaneous
The Miscellaneous tab has two options:
Track Symbol (see Toggle
Symbol Tracking for description of the feature)
Send notification when ticks match filter (sends an audible notification based on the value set in the Global Configuration window)
Check the box on the desired option and press OK.
A quick trade can be issued directly from Equity Time and Sales. The quick trade feature is a Last-type, BUY order for 100 shares of a selected security.
Issue a Quick Trade
There are two methods for issuing a quick trade:
Click
on a symbol name in Equity Time and Sales and press CTRL
+b.
Click on a symbol name in Equity Time and Sales. Right-click and select Quick Trades and click the mouse over the quick trade info.
A Send-Order confirmation window will display. Press OK to initiate a quick trade.
A new order can be issued from Equity Time and Sales. When selected, the Order Ticket displays.
Issue a New Order
There are 3 ways to issue a new order:
Press
Ctrl +n.
Right-click
in Equity Time and Sales and select New
Order.
From the WTP toolbar select Time and Sales-->Action-->New Order.
Cancel an Order
Orders that have not filled can be selectively canceled (for a specific symbol) or globally canceled (all open orders).
Selectively Cancel an Order
Click the
left or right mouse button in Equity Time and Sales on the row
containing the symbol that is to be canceled.
Press Ctrl +z.
Alternate
Methods:
Right-click and select Cancel
All For Symbol _ _ _
From the WTP toolbar, select Time
and Sales-->Action-->Cancel All For Symbol _ _ _
Cancel All Orders
Right-click
on Equity Time and Sales and select Cancel All Orders.
Alternate Method:
From the WTP toolbar, select Time and Sales-->Action-->Cancel
All Orders.
Equity Time and Sales can track a symbol that's been called in another WTP applet.
Enable Toggle Symbol Tracking
With right mouse button click on Equity Time and Sales. Click on Toggle Symbol Tracking.
Alternate Method:
Click on Time and Sales from the WTP toolbar and select Config-->Toggle Symbol Tracking.
To learn more about the Toggle Symbol Tracking feature click here.
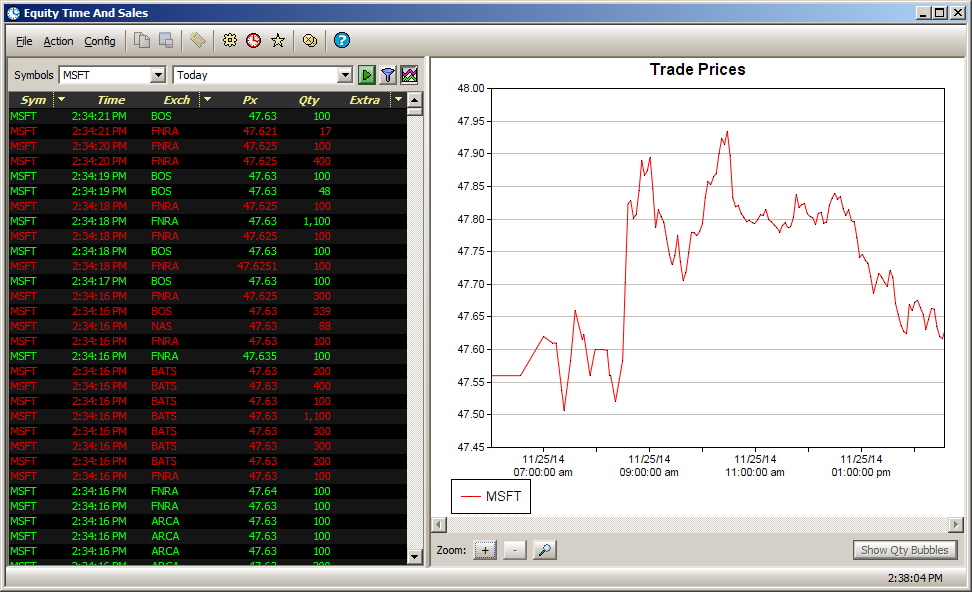
A chart quoting the price
of a selected security can be displayed. Press the chart button  to view the chart.
The chart is designed to show all individual trades. When there are too many trades in the view, the prices are averaged to create a line chart of the average sale price (as seen in the chart above).
To see individual trades, zoom in on the chart using the zoom feature (below).
Zoom Feature
To zoom into the chart by a fixed amount, press the + key. Press the — key to zoom outward (per each click) from the current display.
To zoom to a specific
area of the chart, select the magnifying glass button  . Click and drag the mouse
button to define an area that is to be zoomed:
. Click and drag the mouse
button to define an area that is to be zoomed:
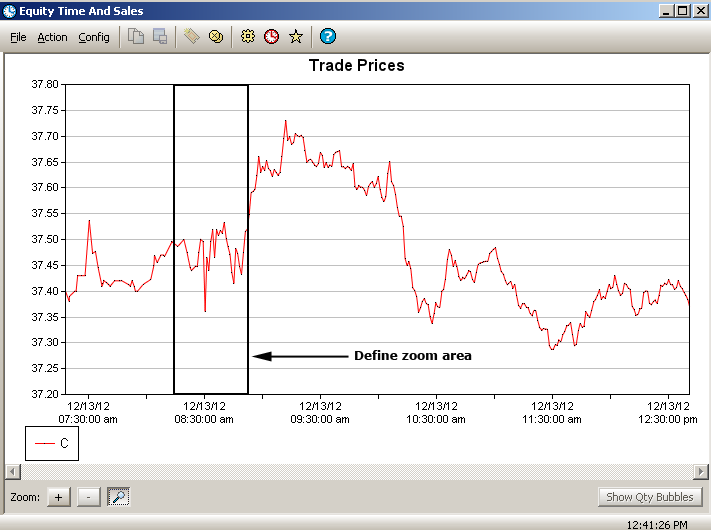
Zoom area defined
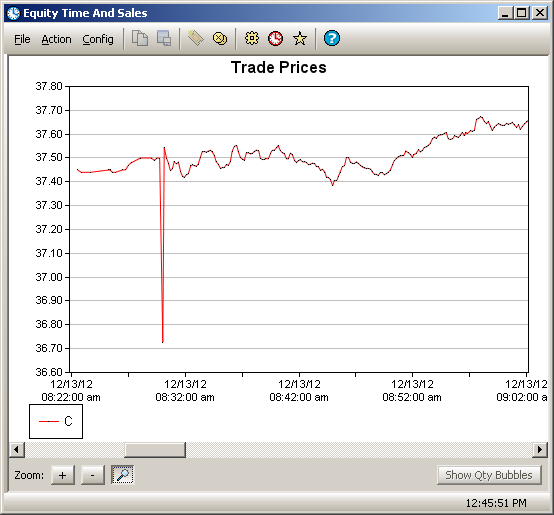
Defined area after issuing zoom command.
To zoom closer with the magnifying tool, click the mouse. Each subsequent click will zoom in closer to a specific point on the chart.
Show Qty Bubbles
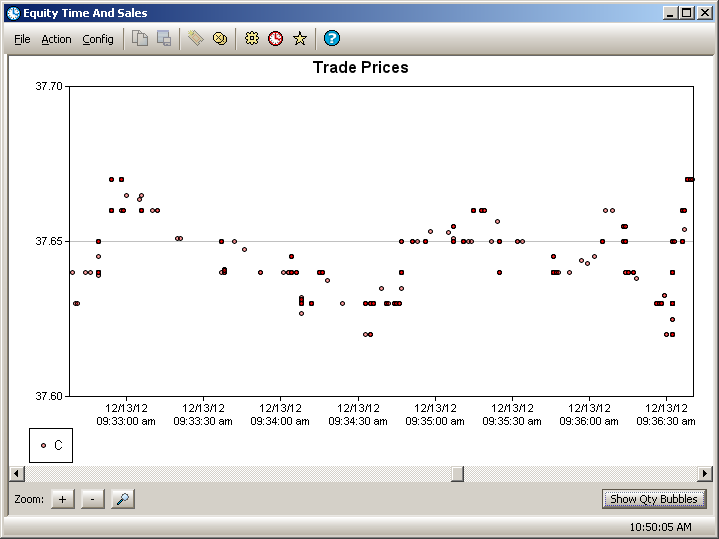
Individual trades displayed in the chart. Zoom into the chart will displays these trades.
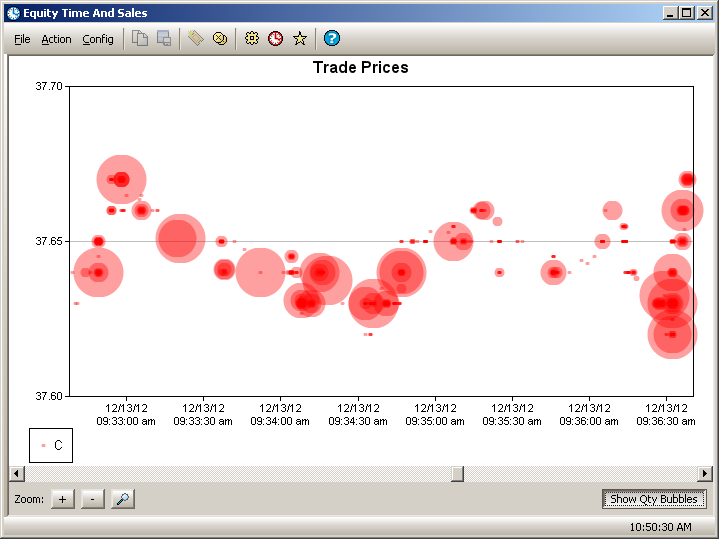
Select Show Qty Bubbles to display the individual trades as quantity bubbles.
The circles in a bubble chart represent different data values. The size of the bubble reflects the size of a trade. The position of a bubble mimics that of an individual tick.
Enable the Show Qty Bubbles Button
The Show Qty Bubbles button is available for selection only when individual ticks are displayed in the graph. Zooming into the graph allows for the display of individual ticks. Press the Show Qty Bubbles button to display the bubble chart.
Display Data From the Bubble Chart
When the mouse hovers over a bubble, data about the tick is displayed. In the image below, an individual tick is identified with the following information: symbol name, date, time, quantity, price.
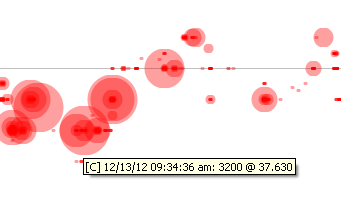
Tick data displayed when hovering the mouse over a bubble.
View
tick-by-tick details for all Option products by clicking the Option
Mode button ![]() . This will
change Equity Time and Sales to Option Time and Sales.
. This will
change Equity Time and Sales to Option Time and Sales.
The settings on Equity Time and Sales can be saved as a template. For example, if Equity Time and Sales has been configured with multiple symbols and filters, these settings could be saved. Next time the applet is called, the saved template can be accessed with all the configuration settings in place.
Learn more about saving and calling templates here.
The data in Equity Time and Sales can be exported to a file, the clipboard, or to Microsoft Excel.
Learn how to export grid data here.
![]()
© 2015 Wolverine Execution Services, LLC