

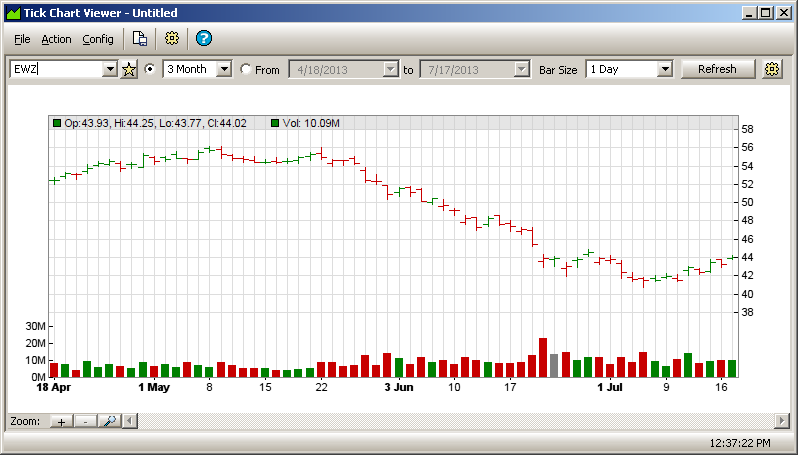
Tick Chart Viewer displays charting data for stocks. Various chart types can be configured including HLOC (high/low/open/close), Candle Stick, Closing, Median, and Typical prices, and Weighted closing.
Configuration consists of beginning and end dates. Real-time charting can be configured as well as the time period for reporting trades. Tick Chart Viewer's optional bar graph can be setup to display data in increments from one minute to one day.
New orders can be placed and canceled and other WTP applets can be opened via the Action menu.
From the WTP Toolbar, select Analyze then Tick Chart Viewer.
Alternate Method:
From the WTP menu select Tick Chart Viewer.
Select the charting date range in Tick Chart Viewer by one of two methods:
From
the drop-down list of preset dates
Manually entering the date range
Press the radio button next to the drop-down list select one of the following:
Today
Week
Month
3 Month
Year
YTD (year to date)
To manually enter the from/to dates, press the radio button next to From and type in the date range or select the dates from the drop-down list.
The horizontal axis in Tick Chart Viewer reflects incrementally the selection made in the Bar Size drop-down list. Select one of the following:
1 Minute
5 Minutes
10 Minutes
1 Hour
6 Hours
1 Day
Press the Refresh Button as often as desired to repaint Tick Chart Viewer data.
Tip: It might be beneficial to lower the Bar Size reporting times to avoid continued use of the Refresh button.
The zoom function is located on the lower left corner of Tick Chart Viewer. To zoom in on the chart, press the + key. A zoom tool in the shape of a magnifying glass will appear in the chart. Repeated pressing of the tool brings up a higher level of magnification. When zooming in on a chart, horizontal scrolling is enabled.
Pressing the — zoom key results in the "zoom out" tool being displayed in Tick Chart Viewer. Repeated pressing of this tool causes the chart to reverse its previous zoom level, eventually resulting in the original non-zoom display.
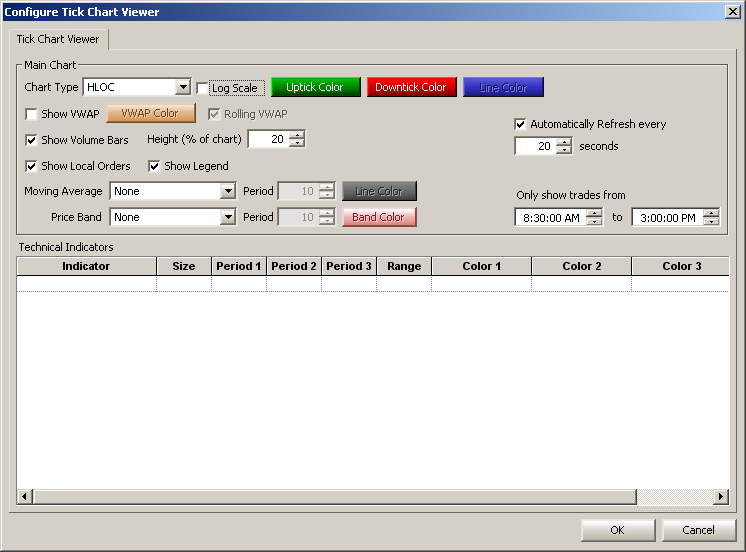
A number of display options are configured through Tick Chart Viewer's configuration window including the chart type, color display, moving average and price band types.
Open the Configuration Window
Press the configuration button
![]() .
.
Alternate Method:
From the Config menu select Configuration.
Different data is displayed depending on the selected chart.
From the drop-down list select the desired chart type:
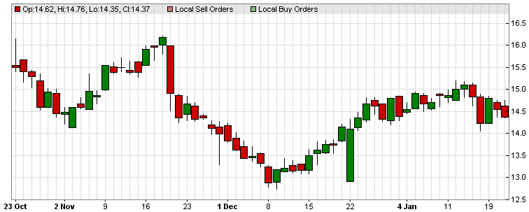
HLOC (High Low
Open Close)—default (see image at the top of
the page)
Charted data displayed:
Opening, High, Low, and Closing Prices
Local Buy Orders (optional)
Local Sell Orders (optional)
Candle Stick—Charting
that displays the following:
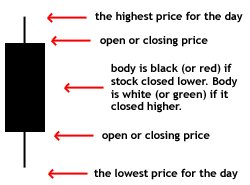
Candle
Stick chart
Charted data displayed: Same as HLOC
Closing Price—a
single line plotted for the closing price of a selected bar size.
Charted data displayed:
Closing Price
Local Buy Orders (optional)
Local Sell Orders (optional)
Median Price—a
single line plotted for the median (i.e., mid-point) price of
a selected bar size.
Charted data displayed:
Median Price
Local Buy Orders (optional)
Local Sell Orders (optional)
Typical Price—a
single line plotted for the typical price (i.e., average price)
of a selected bar size.
Charted data displayed:
Typical Price
Local Buy Orders (optional)
Local Sell Orders (optional)
Weighted Close—a
single line plotted for the weighted close of a selected bar size.
The weighted close is calculated as: (High + Low + Close
x 2) / 4
Charted data displayed:
Weighted Close Price
Local Buy Orders (optional)
Local Sell Orders (optional)
The default display for Tick Chart Viewer is via the linear scale axis.
Check the Log Scale box to have the Chart Viewer display charting data using the logarithmic scale axis.
The Log Scale applies only to the price axis.
The line colors displayed in the chart types can be configured.
For the HLOC and Candle Stick Chart types:
Click on either the Uptick Color box (green by default) or Downtick Color box (red by default) to open a color window where a basic color can be selected or a custom color can be defined.
For Closing Price, Median Price, Typical Price, and Weighted Close Chart types:
Click on the Line Color box to open the color window where a basic line color can be selected or a custom color defined.
Click the Show VWAP (Volume Weighted Average Price) box to display its charted data.
VWAP Color
Click the VWAP Color button to open a color window where a basic VWAP line color can be selected or a custom color defined.
Rolling VWAP
A non-rolling VWAP is the default VWAP setting and generally follows the graph data in whatever chart type has been selected.
A rolling VWAP is calculated as a weighted average of all VWAPs.
Volume Bars display volume data for a selected stock based on the number of shares traded and encompasses the selected date range. The Volume Bars are placed at the bottom of Tick Chart Viewer.
By default, the Show Volume Bars box is checked. To not display Volume Bars, uncheck this box.
Height of Volume Bars
By default the height of the Volume Bars is 20% (or one-fifth) the size of Tick Chart Viewer.
To increase the size of the Volume Bars key in a percentage value (or select a value from the spinner arrows). As a general rule, limit the size of the Volume Bars to 50% of Tick Chart Viewer to allow the Volume Bars and Tick Chart Viewer data to be equally visible.
Show Local Orders refers to executed orders only.
Check the Show Local Orders box to display Local Sell Orders and Local Buy Orders in Tick Chart Viewer.
By default, the legend in Tick Chart Viewer is displayed. Un-check the Show Legend box to hide the legend.
Moving averages display an overall trend direction and are normally calculated using a stock's closing price. Moving averages can also be determined with median, typical, or weighted close prices.
Select a Moving Average Type
From the drop-down list in the Moving Average field, select a moving average type:
Simple—The
average stock price over a certain period of time
Exponential—Similar
to a Simple Moving Average. an exponentially weighted moving average
gives more credence to a most recent time period (i.e., what trades
are doing now).
Triangular—The
triangular moving average gives more weight to the middle values
of moving average data rather
than early or late values.
Weighted—The weighted moving average is the weighted average of the last number of a defined time period.
Select a Moving Average Time Period
Key in a value (or use the up/down spinners) that represent the value of the selected Bar Size in which the Moving Average is calculated. For example, if the Bar Size is set for one day and the Moving Average period is set for 20, then 20 days are plotted.
Define a Moving Average Line Color
Press the Line Color button to open the color window where a basic color or custom color can be defined for the moving average line.
One of three price bands (price range which stocks are priced) can be charted in Tick Chart Viewer.
Select one of the following price bands from the drop-down list:
Bollinger
Bands—Provide a relative analysis in which graph lines
are plotted by two standard deviations above
and below a moving
average.
A market which approaches an upper band is usually thought of as
being overbought while a market approaching the lower band is
thought of as oversold.
Donchian
Channel—Similar to Bollinger Bands, Donchian Channel
performs a calculation using only the recent
high and low prices (rather than standard deviations).
Envelope—Band envelope consists of moving averages calculated from the underlying price that is shifted up and down by a fixed percentage. These averages can be simple, exponential, or weighted.
Select a Price Band Time Period
Key in a value (or use the up/down spinners) that represent the number of days in which the price band is calculated.
Define a Price Band Line Color
Press the Line Color button to open the color window where a basic color or custom color can be defined for the price band line.
Check the Automatically Refresh Every box and enter a value (in seconds) to have Tick Chart Viewer refresh the chart.
If unchecked, Tick Chart Viewer will only refresh when the Refresh button (above the chart) is pressed.
The minimum refresh interval is 10 seconds.
Tick Chart Viewer will show trades only from a specifically defined time period.
Manually key in the start/stop times or use the up/down spinner arrows.
There are a number of technical indicators from which to choose. These indicators are charted in its own graph below Tick Chart Viewer. Depending on the selected indicator, up to three colors are defined. As with all colors in Tick Chart Viewer, they can be customized.
With each indicator are a number of customized fields that are defined. The fields that can be edited (those with up/down spinner arrows) are dependent on the selected technical indicator:
Size—The
height of the indicator chart in pixels.
Period
(1, 2, 3)—The period to compute the indicator.
Range—Defined
by the chart type.
Color (1, 2, 3)—The color(s) used to represent a specific indicator line. Each color can be customized.
Select an indicator from the drop-down list in the Indicator field.
More than one technical indicator can be simultaneously defined. Each defined technical indicator is stacked in its own chart.
Accumulation/Distribution—Determined
by the changes in price and volume. As the indicator grows it
refers the buying of a security. If it drops it indicates the
selling of a security.
Aroon—Used
for defining trends. An Up indicator and a Down indicator are
displayed.
Aroon
Oscillator—The trend stop and start of a sideways trend
and is calculated as the difference between Aroon Up and Aroon
Down.
Average
Directional Index—Determines a price trend (positive,
negative, average).
Average
True Range—An indicator showing the volatility of the
market.
Bollinger
Band Width—Represents the expanding and contracting
of the bands based on market volatility.
Commodity
Channel Index—The deviation of the commodity price
from its average statistical price (defined with an indicator
line, above and below thresholds).
Chaikin
Money Flow—Based on the observation that buying support
is normally signaled by increased volume and frequent closes in
the top half of the daily range. Selling pressure is seen by increased
volume and frequent closes in the lower half of the daily range.
Chaikin
Oscillator—The difference of the moving averages of
the Accumulation/Distribution
indicator.
Chaikin
Volatility—A determination of the volatility of financial
data using the percentage of change in a moving average of the
high vs. low price over a given time.
Period 1: The period to smooth the range.
Period 2: The period to compute the rate of change of the smoothed
range.
Close
Location Value—A measure to determine where the price
of a stock closes relative to the day's high and low. CLV ranges
between +1 and -1 where +1 means the close is equal to the high
and a value of -1 means the close is equal to the day's low.
Detrend
Price Oscillator—Used to isolate short-term cycles
comparing the closing price to a prior moving average.
Donchian
Channel Width—A moving average plotting the highest
high and lowest low for a set period.
Ease
Of Movement—Highlights the relationship between volume
and price changes used primarily for assessing the strength of
a trend.
Fast
Stochastic—Used to track momentum, two lines are used:
%K compares the
latest closing price to the recent trade range, and %D
is a signal line calculated by smoothing %K.
Period 1: The period to compute the %K line.
Period 2: The period to compute the %D line.
MACD—Moving Average
Convergence Divergence. MACD measures
the distance between two moving average lines and used to trade
trends.
Period 1: The first moving average period to compute the indicator.
Period 2: The second moving average period to compute the indicator.
Period 3: The moving average period of the signal line.
Mass
Index—Used in the detection of trend turns based on
changes in the bandwidth between the maximum and minimal price.
If the bandwidth expands, the Mass Index increases. If it narrows,
the Mass Index decreases.
Money
Flow Index—An indicator which shows the rate at which
money is invested into a security and then withdrawn from it.
Range: The distance between the middle line and the upper and lower
threshold lines.
Momentum—A
measurement of the amount that a security's price has changed
over a given time span. It is calculated as a ratio of today's
price to the price of several periods ago.
Moving
Standard Deviation—A measure of market volatility (though
it makes no prediction of market direction).
Negative
Volume Index—An index that focuses on the days where
the volume has significantly decreased from the previous day's
trading.
On
Balance Volume—An indicator that adds a period's volume
when the close is up and subtracts the period's volume when the
close is down. The concept is that volume precedes price.
Performance—The
performance indicator of a selected security.
Percentage
Price Oscillator—A technical momentum indicator showing
the relationship between two moving averages based on price.
Period 1: The first moving average period to compute the indicator.
Period 2: The second moving average period to compute the indicator.
Period 3: The moving average period of the signal line.
Positive
Volume Index—An index that focuses on days where the
volume has significantly increased from the previous day's trading.
Percentage
Volume Oscillator—A technical momentum indicator showing
the relationship between two moving averages based on volume.
Period 1: The first moving average period to compute the indicator.
Period 2: The second moving average period to compute the indicator.
Period 3: The moving average period of the signal line.
Price
Volume Trend—A technical indicator used to determine
the balance between a stock's demand and supply depending upon
its upward and downward movement.
Rate
of Change—The speed at which a variable changes over
a specific time period. The rate of change is represented by the
slope of the line.
Relative
Strength Index—A technical momentum indicator that
compares the magnitude of recent gains to recent losses in an
attempt to determine overbought and oversold conditions of an
asset.
Range: The distance between the middle line and the upper and lower
threshold lines.
Slow
Stochastic—An indicator that compares two lines (%K and %D)
to predict the possibility of an uptrend or a downtrend. The %K value is based on
a 3-period moving average of the %K
fast stochastics value. The %D
value is based on a 3-period moving average of the %K
slow stochastics value.
Period 1: The period to compute the %K line.
Period 2: The period to compute the %D line.
Stochastic
RSI—An indicator that ranges between zero and one and
is deemed to be oversold when the value drops below 0.20 meaning
the RSI (Relative Strength Index) value is trading at the lower
end of its predefined range. It also indicates that the
short-term direction of a security is near to a correction. A
reading above 0.80 is indicative that the RSI is reaching an extreme
level and could signal a pullback of a security.
Range: The distance between the middle line and the upper and lower
threshold lines.
TRIX—Used
in determining of overbought or oversold market conditions. A
positive value indicates and overbought market. A negative value
indicates an oversold market.
Ultimate
Oscillator—Combines a stock's price action during three
different time frames. Values range from 0 to 100 with 50 as the
center line. An oversold stock exists below 30 and an overbought
stock extends from 70 to 100.
Period 1: The first moving average period to compute the indicator.
Period 2: The second moving average period to compute the indicator.
Period 3: The third moving average period to compute the indicator.
Range: The distance between the middle line and the upper and lower
threshold lines.
Volume
Indicator—Displays in the same manner as the volume
indicator in Tick Chart Viewer.
William
%R—A momentum indicator that displays the relationship
of the close relative to the high/low range over a defined period
of time (usually 14 days).
Range: The distance between the middle line and the upper and lower
threshold lines.
The value of each plotted point along Tick Chart Viewer's x/y axis is viewed by positioning the mouse over the graph's line.
Local orders are displayed in the chart. They are designated by a square in one of various colors depending on their status. The legend at the top of Tick Chart Viewer defines the various states of an order.
Changed orders are marked with a circle. For non-limit orders that have been changed, the order's average price is displayed.
Canceled orders that have been partially filled are marked with an X. Canceled orders with a zero filled quantity will not be displayed.
For volume data, position the mouse over each bar in the graph for a detailed readout.
Configuration settings for Tick Chart Viewer can be saved in a template. The file will have a .hloct extension.
Also, a desired chart can be saved as a default. Template commands are found in the File menu.
Read more about templates here.
The Save Chart As feature allows you to save a chart as an image file in one of the following formats:
bmp
png
jpg
gif
Save a Chart as an Image File:
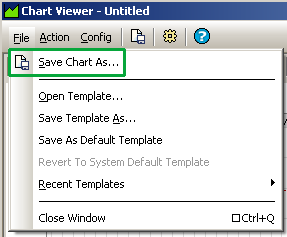
From the File column in Tick Chart Viewer, select Save Chart As...
Alternate
Method:
Right-click anywhere on the chart
itself. Select File Commands-->Save
Chart As...
When the Save As window opens, select a file name, file type, and destination for the chart image.
Open Other WTP Applets from Tick Chart Viewer
Other WTP applets such as the Option Quote Cube via the send to command in the Action menu in Tick Chart Viewer.
The only thing that is actually sent to these applets is the security name currently displayed in Tick Chart Viewer.
Create and Cancel Orders from Tick Chart Viewer
Press Ctrl+n to open the Order Ticket.
Alternate Method:
From the Action menu select New Order.
Press Ctrl+z to cancel all orders for a specific symbol.
Alternate Method:
From the Action menu select Cancel All for Symbol xxx.
Cancel All Orders
From the Action menu select Cancel All Orders.
Launch Equity Time and Sales from Tick Chart Viewer
The Toggle Symbol Tracking function is available in Tick Chart Viewer.
When enabled the symbol in Tick Chart Viewer will change depending on the symbol selected in other WTP applets.
Learn about Toggle Symbol Tracking here.
The status bar displays the current time and ready status of Tick Chart Viewer.
From the Config menu select Status Bar to enable/disable it.
![]()
© 2015 Wolverine Execution Services, LLC